You are here

Particle Simulations of Plasma Turbulence


Massively Parallel Computations in 3D Geometry
 
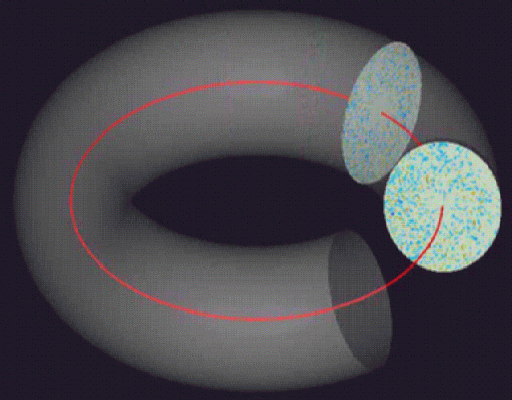
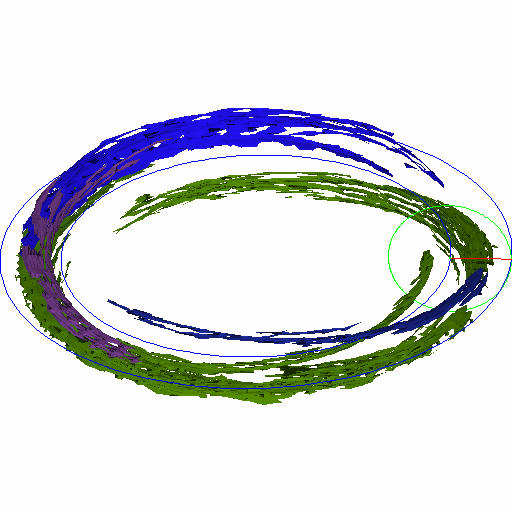
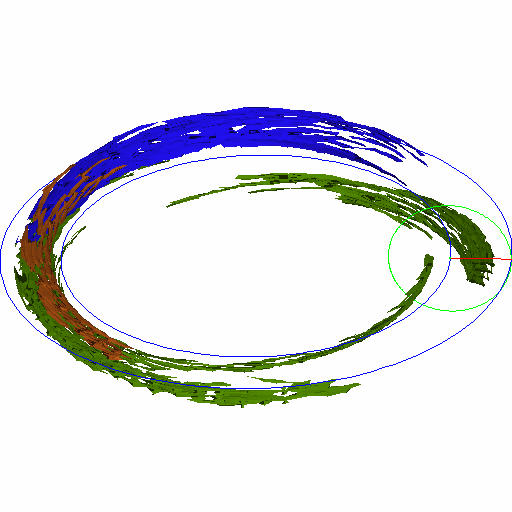
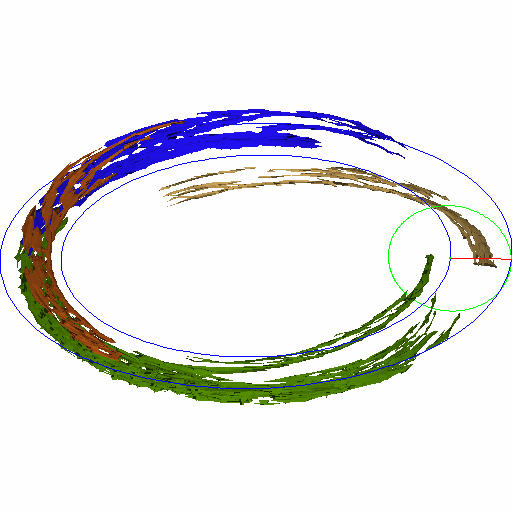
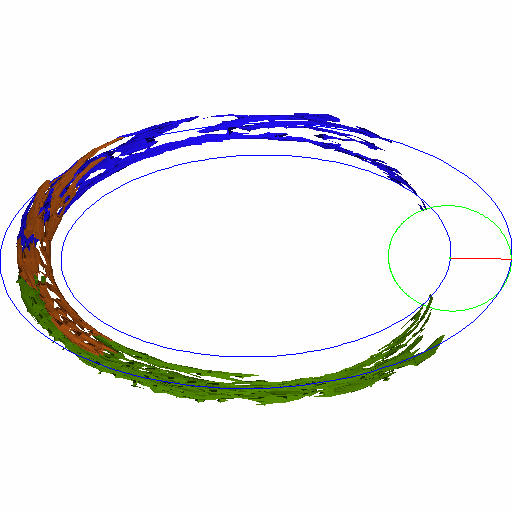
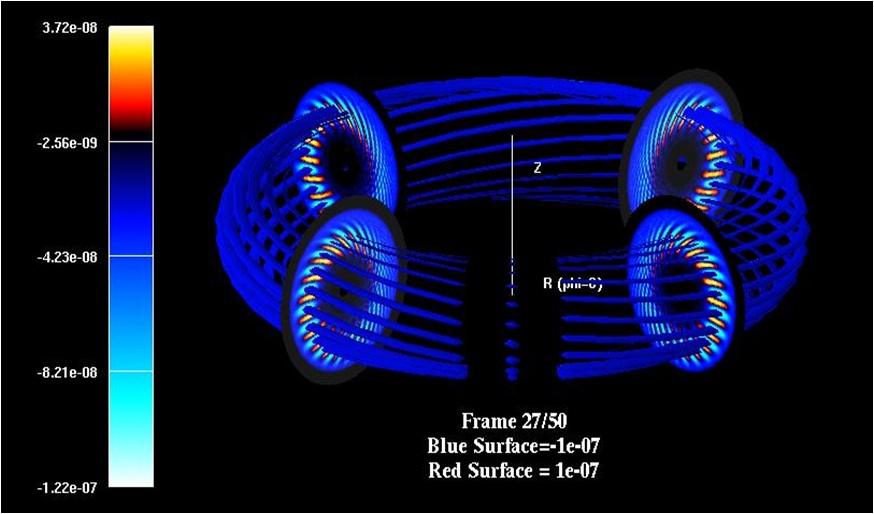
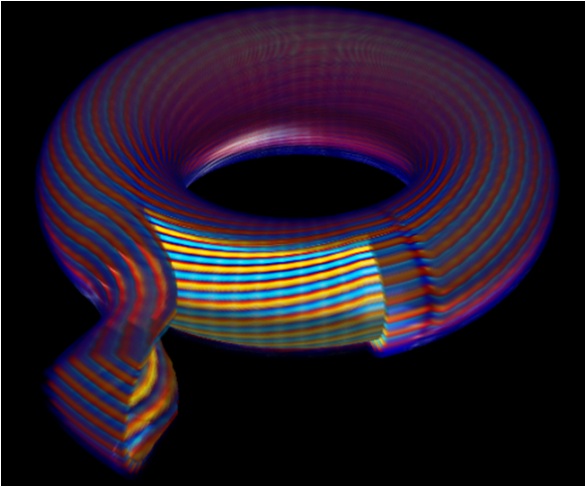
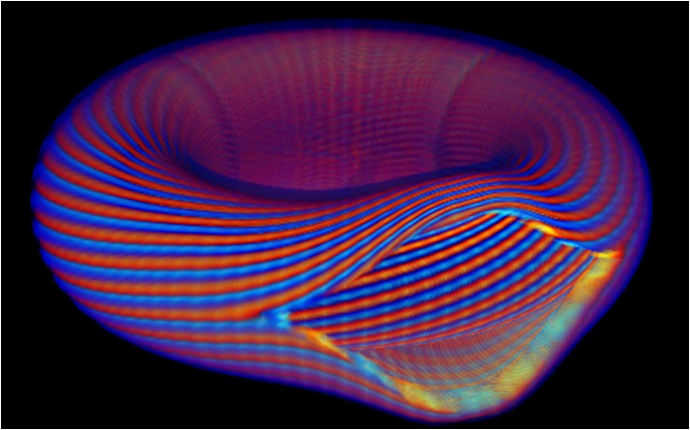
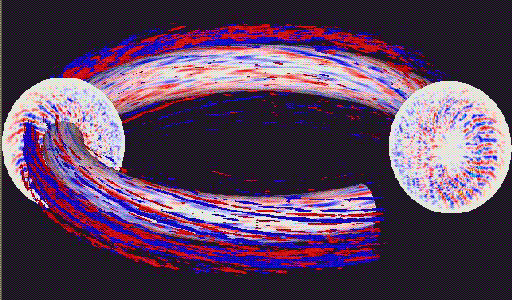
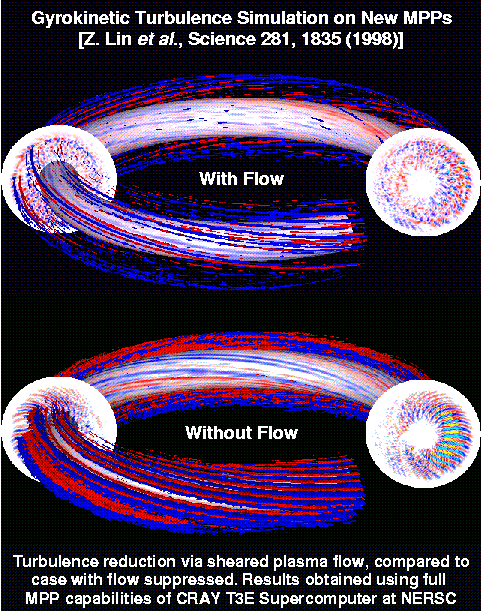
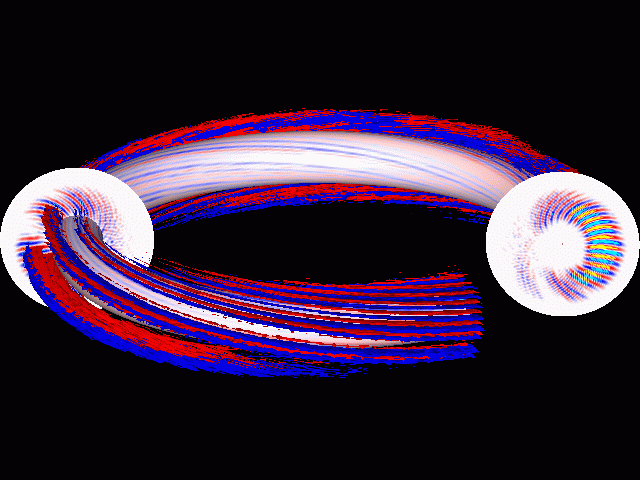
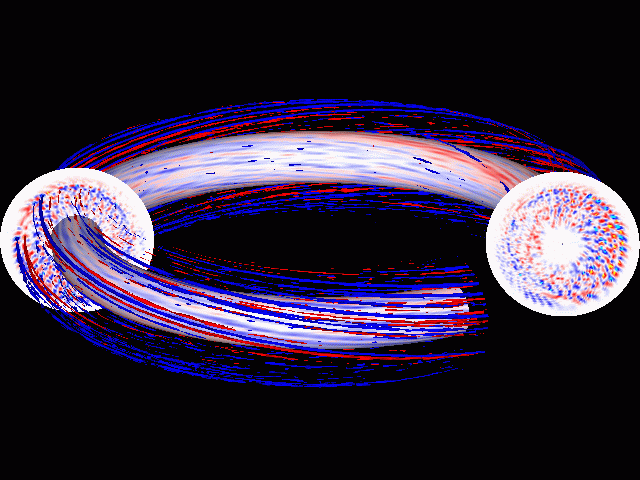
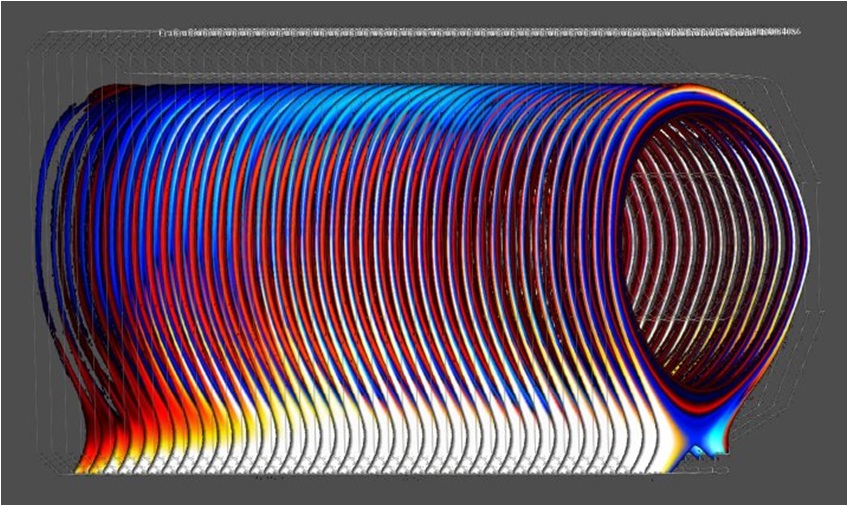
The goal of this project was to provide 3D visualization of particle simulations of plasma turbulence. Visualization is based on Science 281, 1835(1998).The dataset has 1,000 time steps with a resolution of 32x321x129. We visualize turbulent electrostatic potential, and show poloidal contour plot, flux-surface contour plot at r/a=0.25, and isosurface of high (red band) and low (blue band) potential.


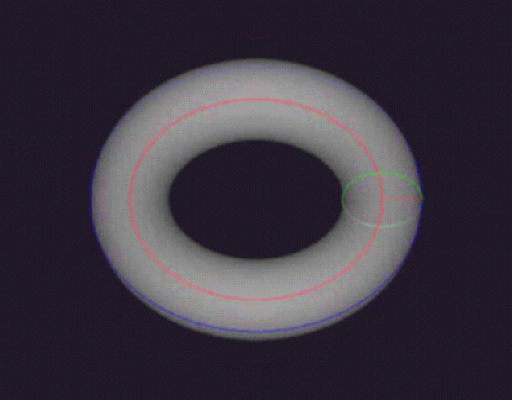
VIEW OF TORUS


INITIAL CONDITION


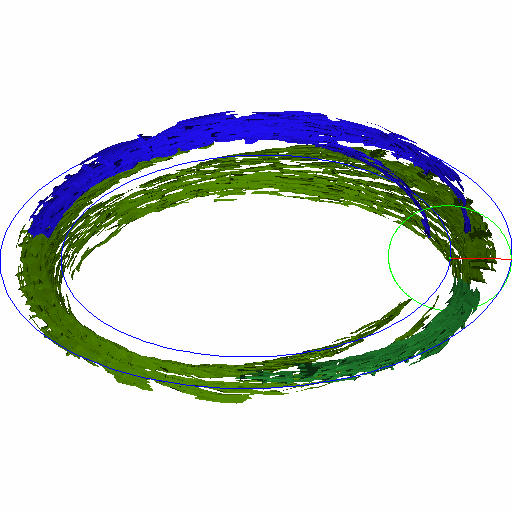
SIMULATION WITH ZONAL FLOWS
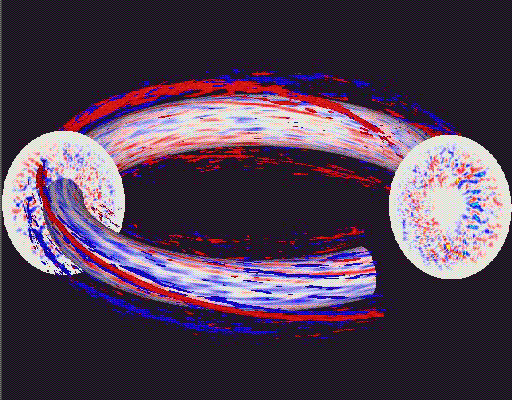


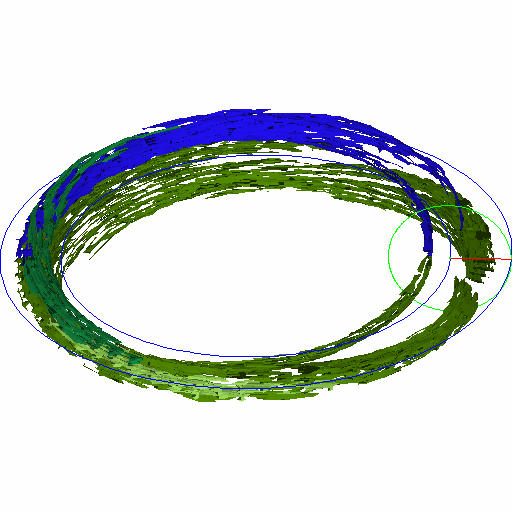
SIMULATION WITHOUT ZONAL FLOWS


COMPARISON OF NONLINEAR MODE STRUCTURE: EFFECTS OF ZONAL FLOWS


LINEAR EIGENMODE: SAME STRUCTURE WITH OR WITHOUT ZONAL FLOWS


NONLINEAR MODE STRUCTURE: DECORRELATION BY ZONAL FLOWS


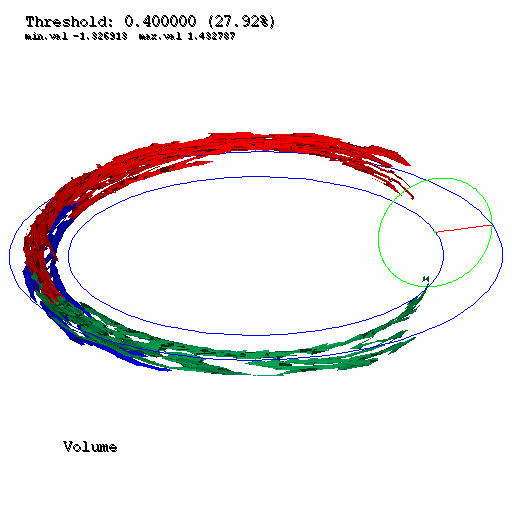
OBJECT SEGMENTATION RESULTS

Object Segmentation Result of BP0500 dataset. Threshold Value is 0.4. Minimum object size is 200.We use computed volume to color the objects.


FEATURE TRACKING RESULTS


                          T0500                                                                     T0519                                                                   T0529
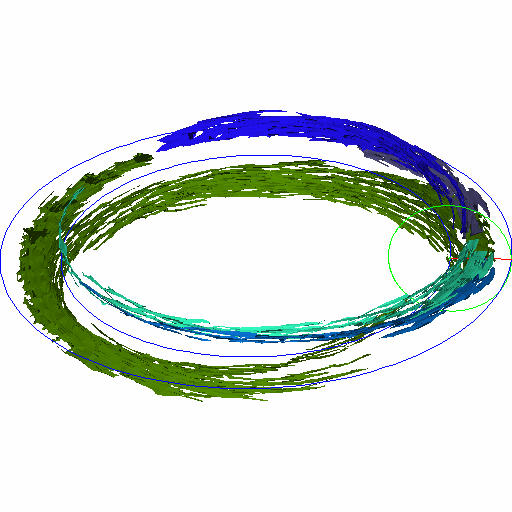


                       T0539                                                                     T0549                                                                   T0559
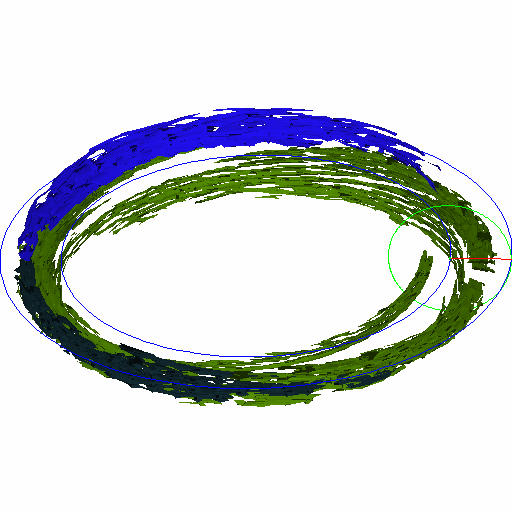


                       T0569                                                                     T0579                                                                   T0599
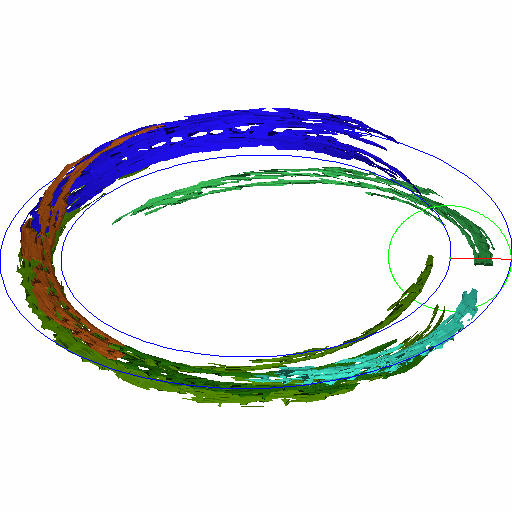


CPES Visualization


We would like to thank Dr. Zhihong Lin at Princeton Plasma Physics Laboratory (PPPL), for the simulation model and dataset.

Theme by Danetsoft and Danang Probo Sayekti inspired by Maksimer