You are here
Tracking Scalar Features in Unstructured Datasets
3D time-varying unstructured and structured datasets are difficult to visualize and analyze because of the immense amount of data involved. These datasets contain many evolving amorphous regions, and it is difficult to observe patterns and visually follow regions of interest. A feature based approach can help, by allowing scientists to concentrate on regions, and follow them over time. In this paper, we present a basic framework for the visualization of time-varying datasets, and a new algorithm and data structure to track volume features in unstructured scalar datasets. The algorithm and data structure are general and can be used for structured, curvilinear, adaptive and hybrid grids as well. The new algorithm has following features:
- Generality: It can handle all the different grid types and grid dimensions with the same data structure and algorithm.
- Speed: It is fast, permitting interactive speeds on reasonable platforms.
- Memory Efficiency: The efficient data structure involves minimum memory overhead.
- Adaptivity: It can be extended to handle adaptive continuum grids with minimum recoding.
Time Varying Visualization
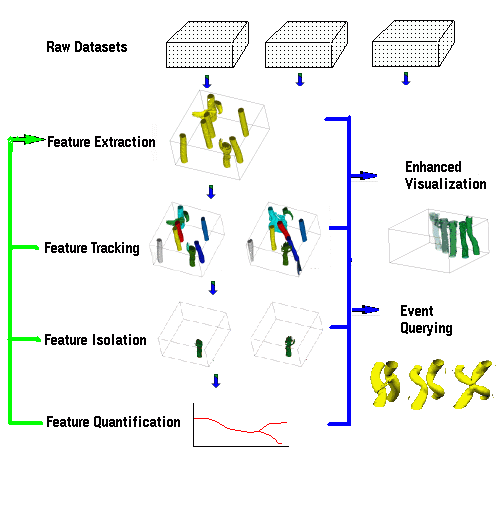
A basic framework for analyzing time-varying datasets is shown below. The goal of the process is to obtain dramatic data reduction and thus help scientists quickly focus on a few features or events of interest.

Examples
Meteorology
This was a simulation using MM5 modeling system of cloud formation over the eastern United States. The simulation consists of 25 datasets at a resolution of 35x41x23. Features are fist extracted at the threshold of 0.00036 on the cloud water with the object segmentation routine. (In this example, we removed small regions with volume<5.) The tracking information is used to color objects, providing visual cues on object evolutions. Images are rendered with FVis5D - a modified version of Vis5D, which incorporates our tracking information.
(The dataset is courtesy of Dr. Bill Kuo and Dr. Wei Wang at Mesoscale Prediction Group, Mesoscale and Microscale Meteorology Division, National Center for Atmospheric Research.)
Isotropic Turbulent Decay Simulation
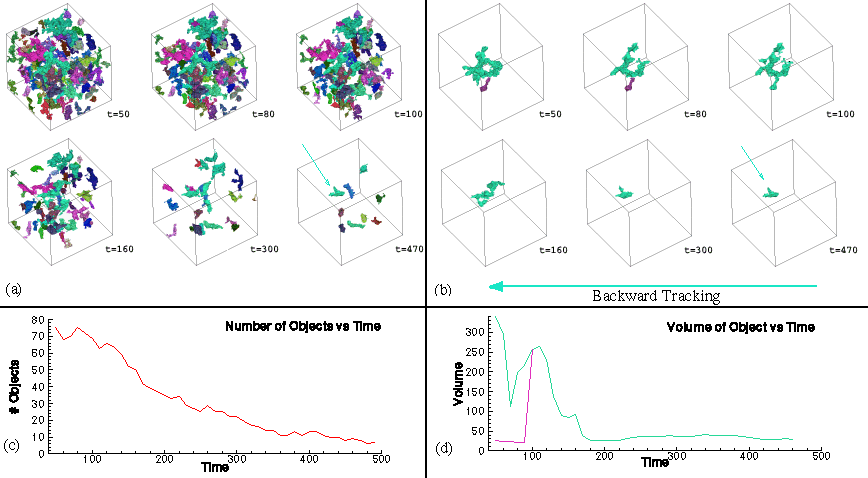
This is an LES simulation of the decay of isotropic turbulence in a box in a compressible flow using unstructured tetrahedral grids. The dataset consists of 500 time steps. The grid contains 35937 nodes and 163840 cells arranged in a cube. The dataset is segmented on vorticity magnitude at threshold of 0.05.

This simulation is courtesy of Prof. D. Knight and Dr. V. Shukla, Department of Mechnical and Aerospace Engineering, Rutgers University.
Oceanography
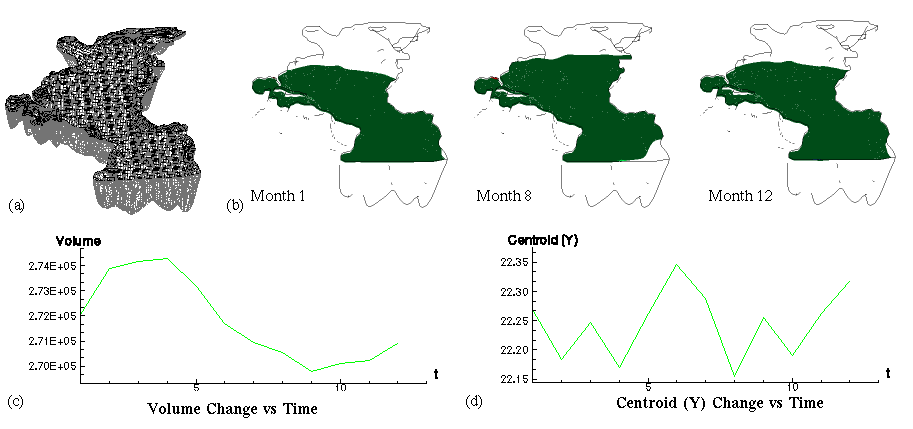
The dataset is derived from observational data for large-scale ocean circulation (the monthly-mean Levitus data set). Spectral grids consisting of 15887 nodes and 240 cells are used to faithfully represent the highly irregular coastline of the ocean basin of the North Atlantic to collect the observation data. Structured grids are formed within each spectral cells to interpolate data to a regular long-latitude grid for simulation with spectral methods. It is actually a nested-hybrid grid mesh which uses a hexahedral grid as a base, and a structured grid within each hexahedral grid. The dataset is converted into unstructured grid with explicit hexahedral connectivity which contains 307300 hexahedral cells with a total 12 time steps. The variable being visualized is potential temperature.


(This simulation is courtesy of Mohamed Iskandarani and Enrique Curchister, at the Institute of Marine and Coastal Sciences, Rutger University.)