You are here
Volume Tracking
Feature tracking can be used to correlate extracted objects from one data set to the next.
Feature Tracking on Unstructured Datasets
FVis5D - Vis5D Enahanced with Feature Tracking
More Details - Download, Install and Use
The evolutionary events can be characterized as follows:
Continuation
An object continues in consecutive time steps (with rotation or translation), as it increase (decreases) in volume or magnitude.
Creation
A new object appears.
Dissipation
An object disappears.
Bifurcation
An object separates into two or more substructures.
Amalmagation
Two or more objects merge.
Assumption
Time between successive data sets is small.
Heuristic
Corresponding objects in succesive data sets overlap in space.
Methods
- Correlation of objects is performed based on minimum difference.
- An octree spatial data structure is used to implement the algorithm.
Examples of 3D Volume Tracking
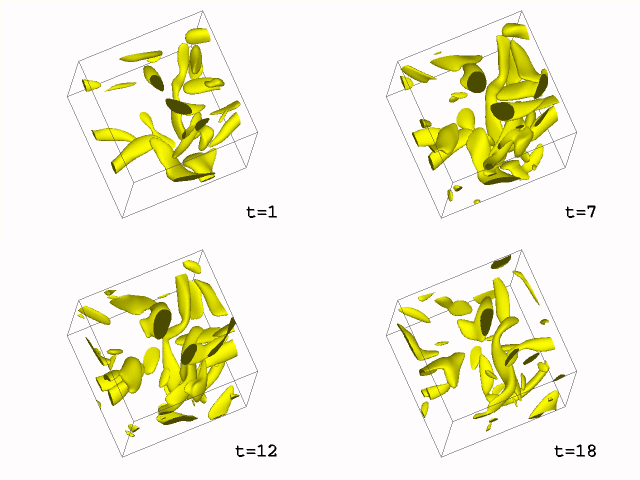
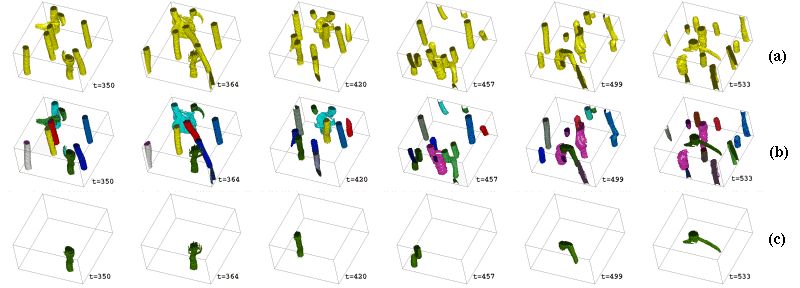
Pseudospectral simulation of coherent turbulent vortex structures with a 128^3 resolution (100 time steps). Variable being visualized is vorticity magnitude (thresholded isosurfaces at 48% of maximum).
Simulations by Dr. V. Fernandez
In this video, no feature tracking was performed. It is hard to visually follow regions and measure their energy change. Feature tracking helps understand the energy transfer mechanisms in these vortex interaction (energy cascade). It is also helpful for data reduction, data base management, and model building.
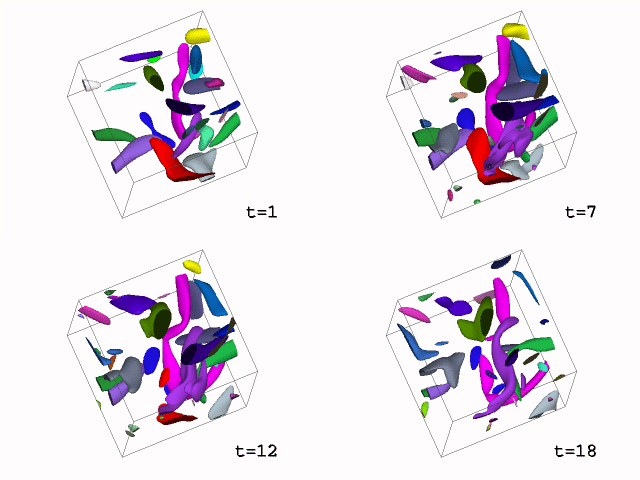
In this animation, feature are extracted using segmentation based upon thresholding, and they are followed over their lifetime. Objects are colored based on the tracking result. The color of an object is inherit from its parent (with the larger volume in the case of amalgamation).
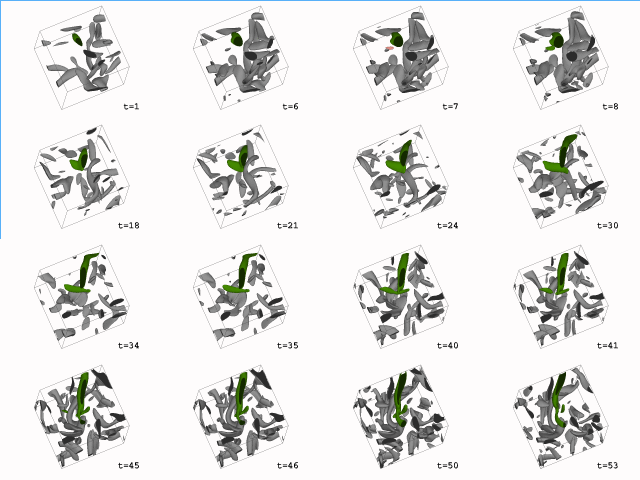
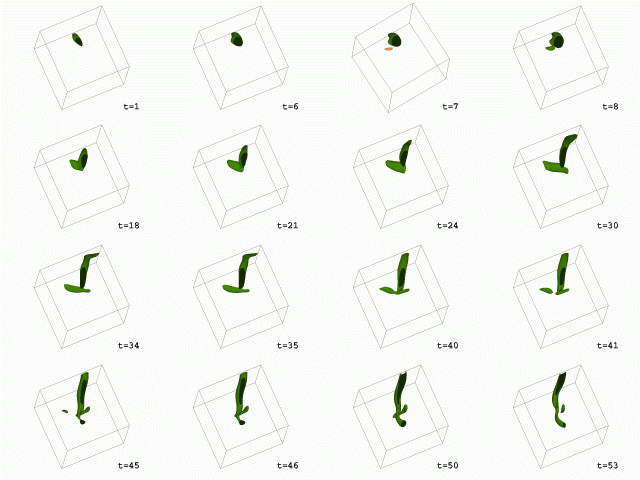
In the first animation, one object is isolated and the rest are colored in grey. In the second animation, one object is isolated and the rest are removed. The change in mass and volume are shown below.


In this animation, objects are rendered with the volume rendering technique to reveal the inner detail. The rainbow colormap indicates the variation of the scalar value inside each object.
Statistics
Once objects have been tracked, we can also track properties of the objects, such as mass, volume, moments, etc.
- Total number of objects Vs Time
- Mass of one object vs time (light green object above)
- Volume of object vs time
- Local maximum of objects Vs Time
Image Gallery
Applications
Geophysics
Inlet Design
NCAR Weather Simulation
IBM Weather Forecast
EPA Weather Simulation
Plume
Isotropic Turbulent Decay Simulation
Oceanography
The Shock-Elliptical Interaction - It has been adapted to 2D dataset!
Acknowledgment
The work is supported by DARPA HPCD (DABT-63-93-C-0064), DOE (DE-FG02-93ER25179.A000), NASA (NAG 2-829), and the CAIP Center.
Xin Wang's Thesis: XinWangPhd.pdf
