You are here
Feature-based Visualization
|
|
ACTIVITY DETECTION FOR SCIENTIFIC VISUALIZATION An activity is a spatio - temporal pattern that spans multiple time steps and include various feature states. For large - scale simulations, the data sets are so massive that it is sometimes a challenge for scientists to efficiently visualize many activity states over different time steps. Therefore in this project, we look for solutions to identify activity that might be happening in a time-varying dataset and visualize it to help scientist better understand and analyze their data. (this work is being supported by DOE DE-FG02-10ER25977 which is part of the SciDAC institute for Ultra-Scale Visualization at UCDAVIS) |
[1] Liu, Li, et al. "An interactive method for activity detection visualization."Large-Scale Data Analysis and Visualization (LDAV), 2013 IEEE Symposium on. IEEE, 2013.
[2] Ozer, Sedat, et al. "Activity detection in scientific visualization." IEEE transactions on visualization and computer graphics 20.3 (2014): 377-390. |
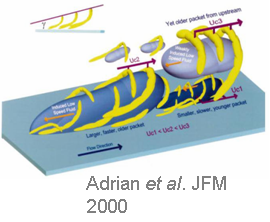 |
Multi-Object (Group) Tracking A group is fundamentally a set of objects that are related "somehow". This relation can be only logical or also physical. The definition of a group changes from domain to domain, and this makes it harder to find a generic framework that could help scientists to define, extract and follow the evolution of groups in their data sets. Moreover, as the data dimensions increase, it becomes more and more apparent that smarter and more meaningful abstractions are necessary in large data visualization. |
Ozer, Sedat, et al. "Group dynamics in scientific visualization." Large Data Analysis and Visualization (LDAV), 2012 IEEE Symposium on. IEEE, 2012. |
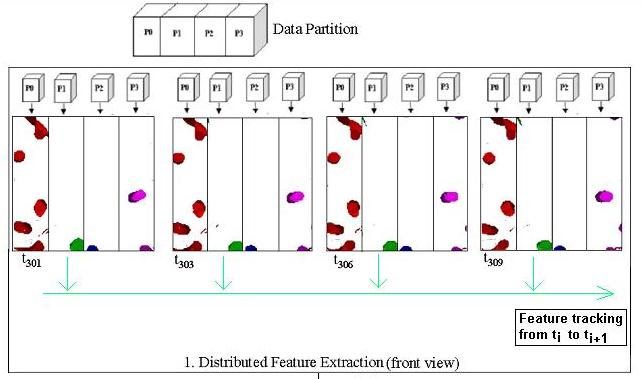 |
Distributed Feature Tracking The size of the data that needs to be processed increases rapidly for the scientists and the researchers, and this is where the distributed system design helps by allowing our feature tracking software to handle and process terabytes of data. Therefore this project focuses on making the feature track software run on multiple nodes for immense sized 3D data sets. |
J. Chen, D. Silver and Y. Kusurkar, Distributed Feature Extraction and Tracking, SPIE IS&T Electronic Imaging Symposium, Visualization and Data Analysis Conference, January 2002, San Jose, CA. |
 |
Feature tracking algorithm aims to track individual objects within each frame, and correlates them to the ones found in the next frame and can also generate statistics, meta-data about the extracted objects.
More about this project can be found here. |
[1] Samtaney, Ravi, et al. "Visualizing features and tracking their evolution."Computer 27.7 (1994): 20-27. [2] Silver, Deborah, and Xin Wang. "Volume tracking." Visualization'96. Proceedings.. IEEE, 1996. [3] Silver, Deborah, and Xin Wang. "Tracking and visualizing turbulent 3d features." Visualization and Computer Graphics, IEEE Transactions on 3.2 (1997): 129-141. [4] Silver, Deborah, and Xin Wang. "Tracking scalar features in unstructured datasets." Visualization'98. Proceedings. IEEE, 1998. |

