You are here
VIZLAB Projects
Here are the work/projects we are working on
 |
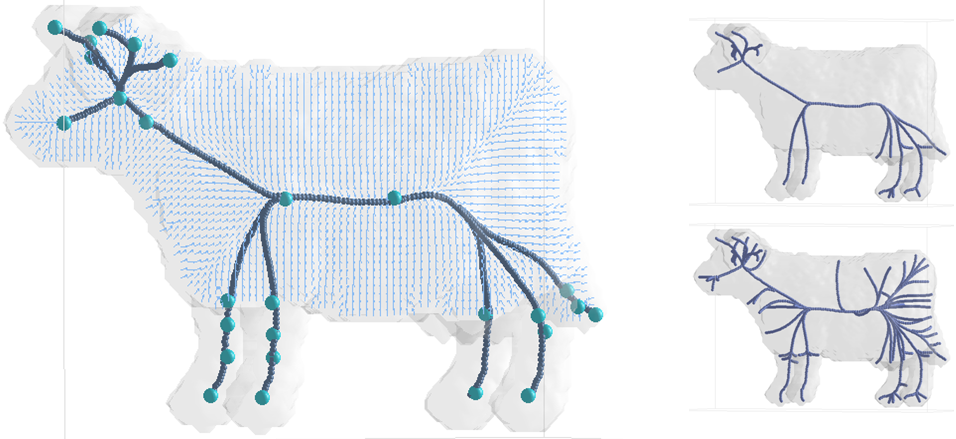
Automated feature computation techniques can significantly reduce the amount of data that needs to be visualized by focusing on just those regions of interest. |
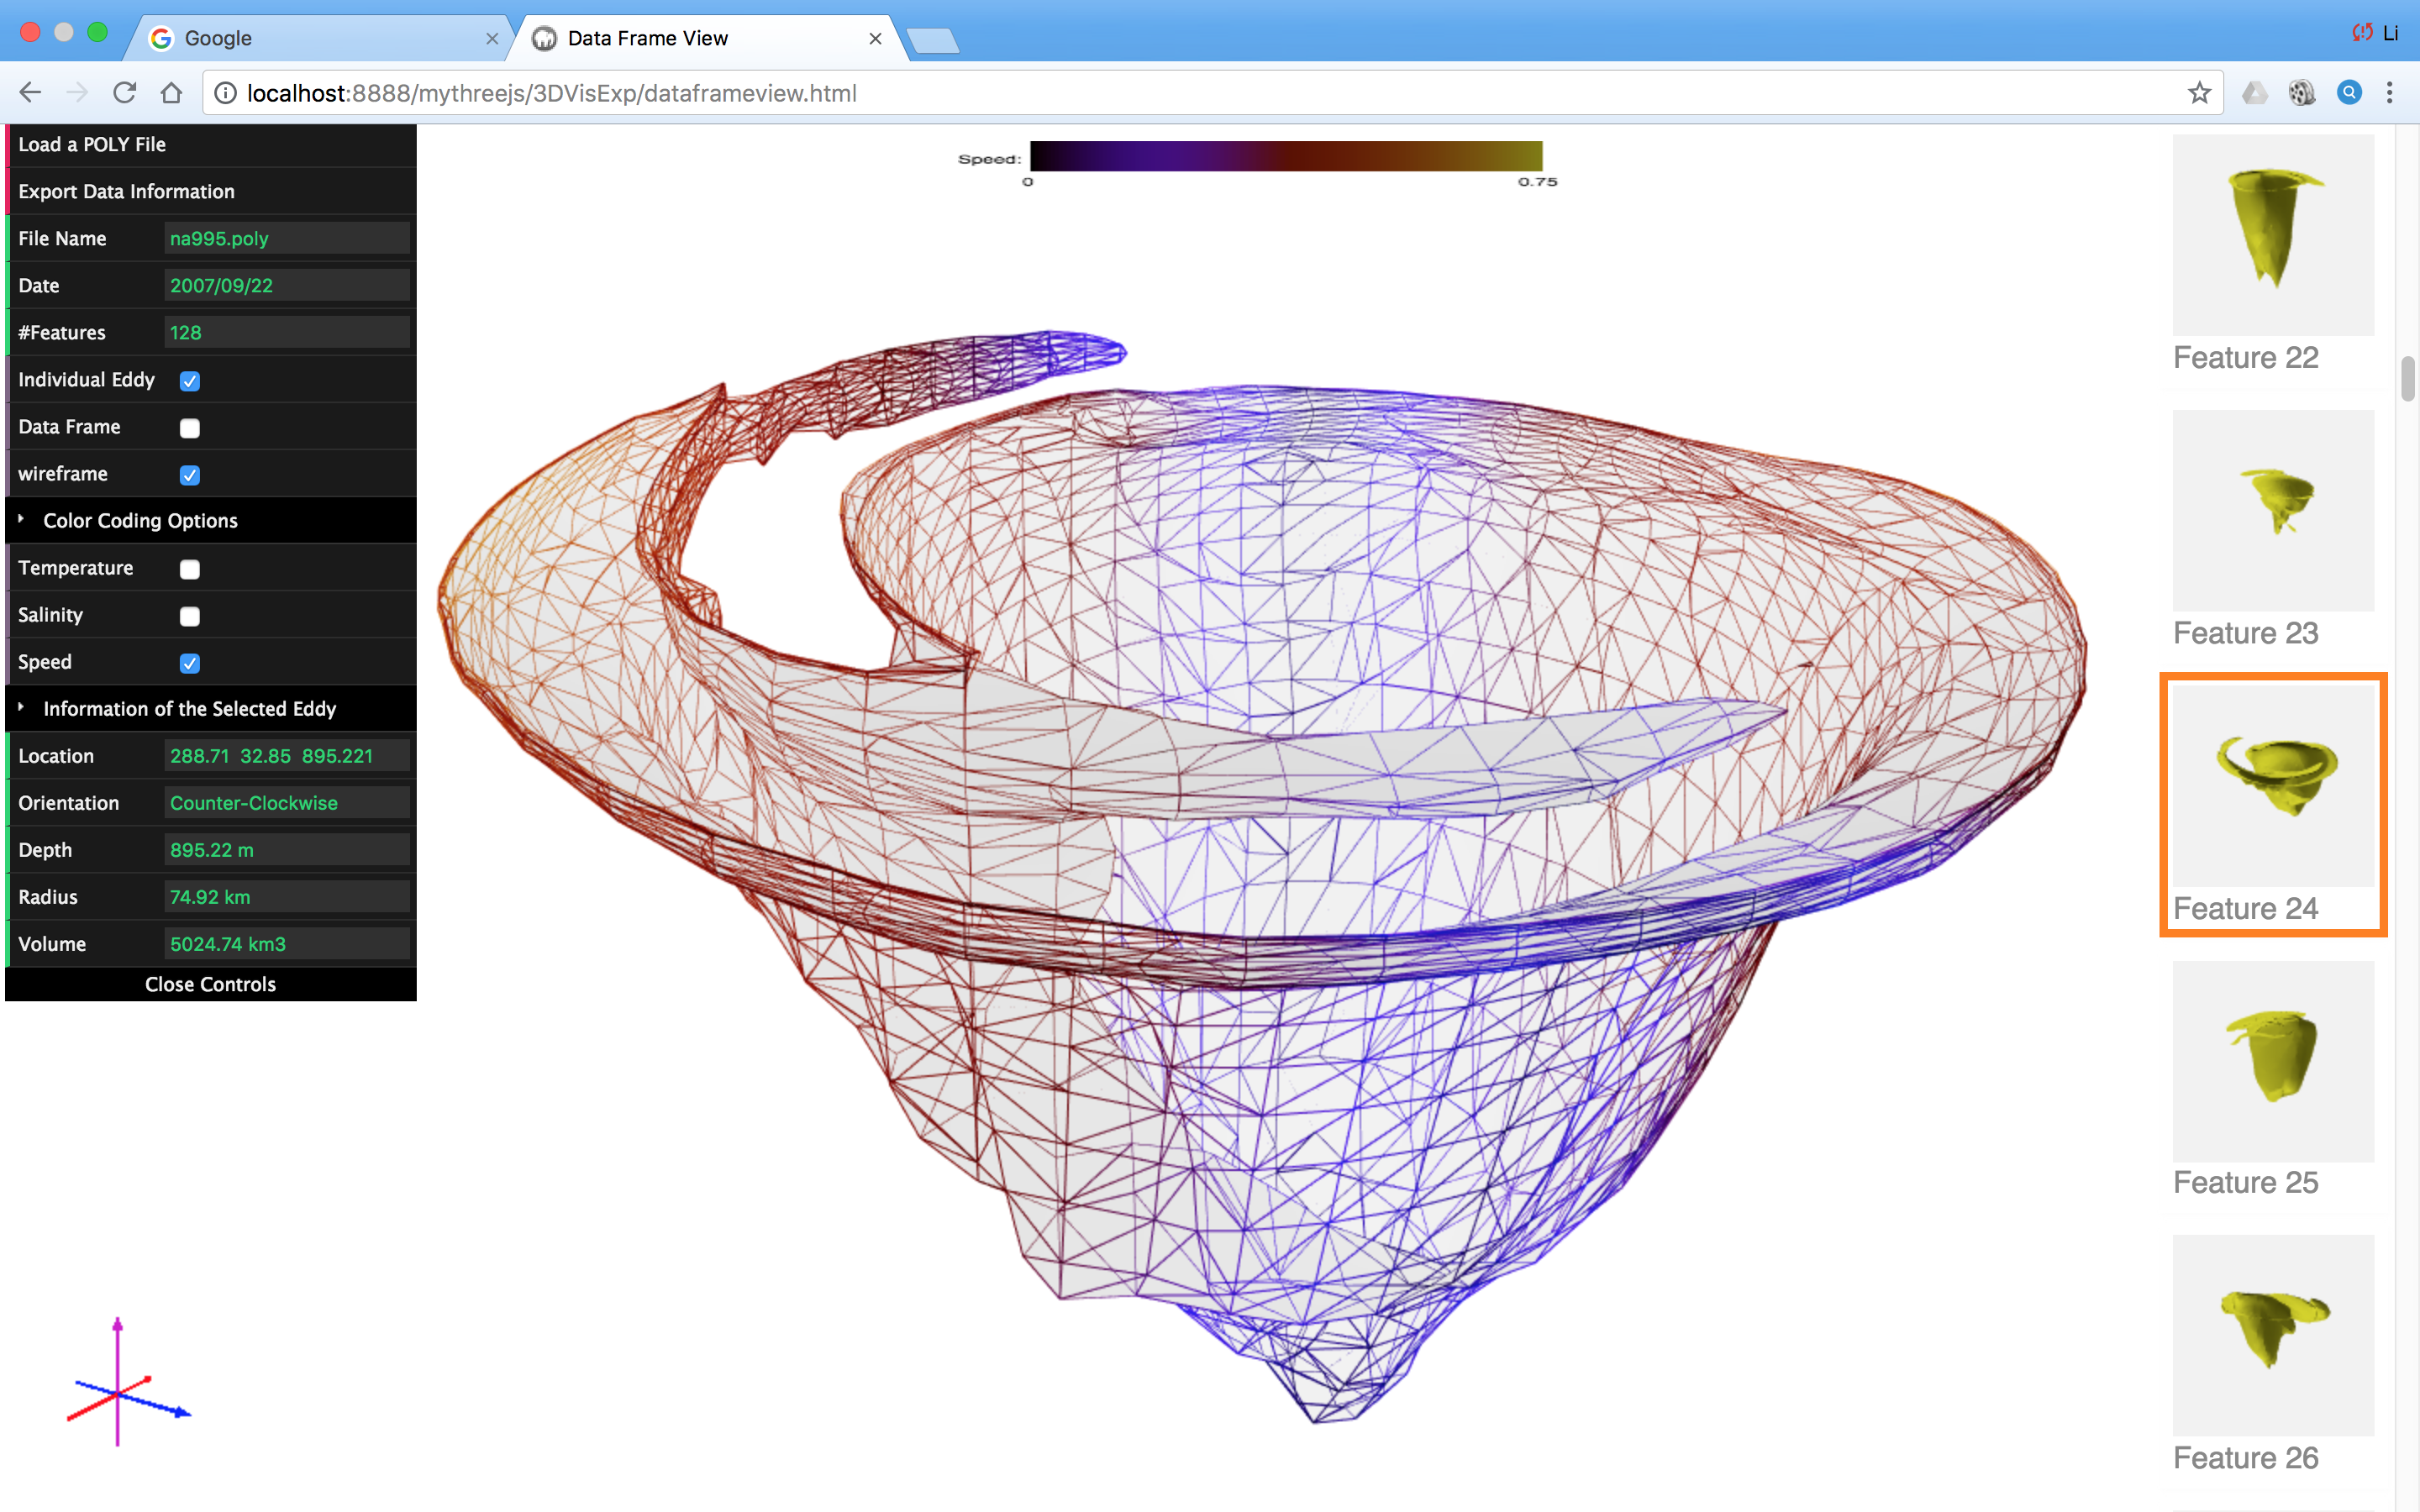 |
WEB-BASED VISUALIZATION FOR 3D TIME SERIES In this project, we proposed an integrated framework for exploratory visualization of time-varying scientific data on modern web browsers. Exploiting the temporal coherence between data frames and the state-of-the-art web technologies (HTML5, JavaScript, and WebGL), a web-based viewer was developed to visualize time-varying scientific data at different levels |
|
|
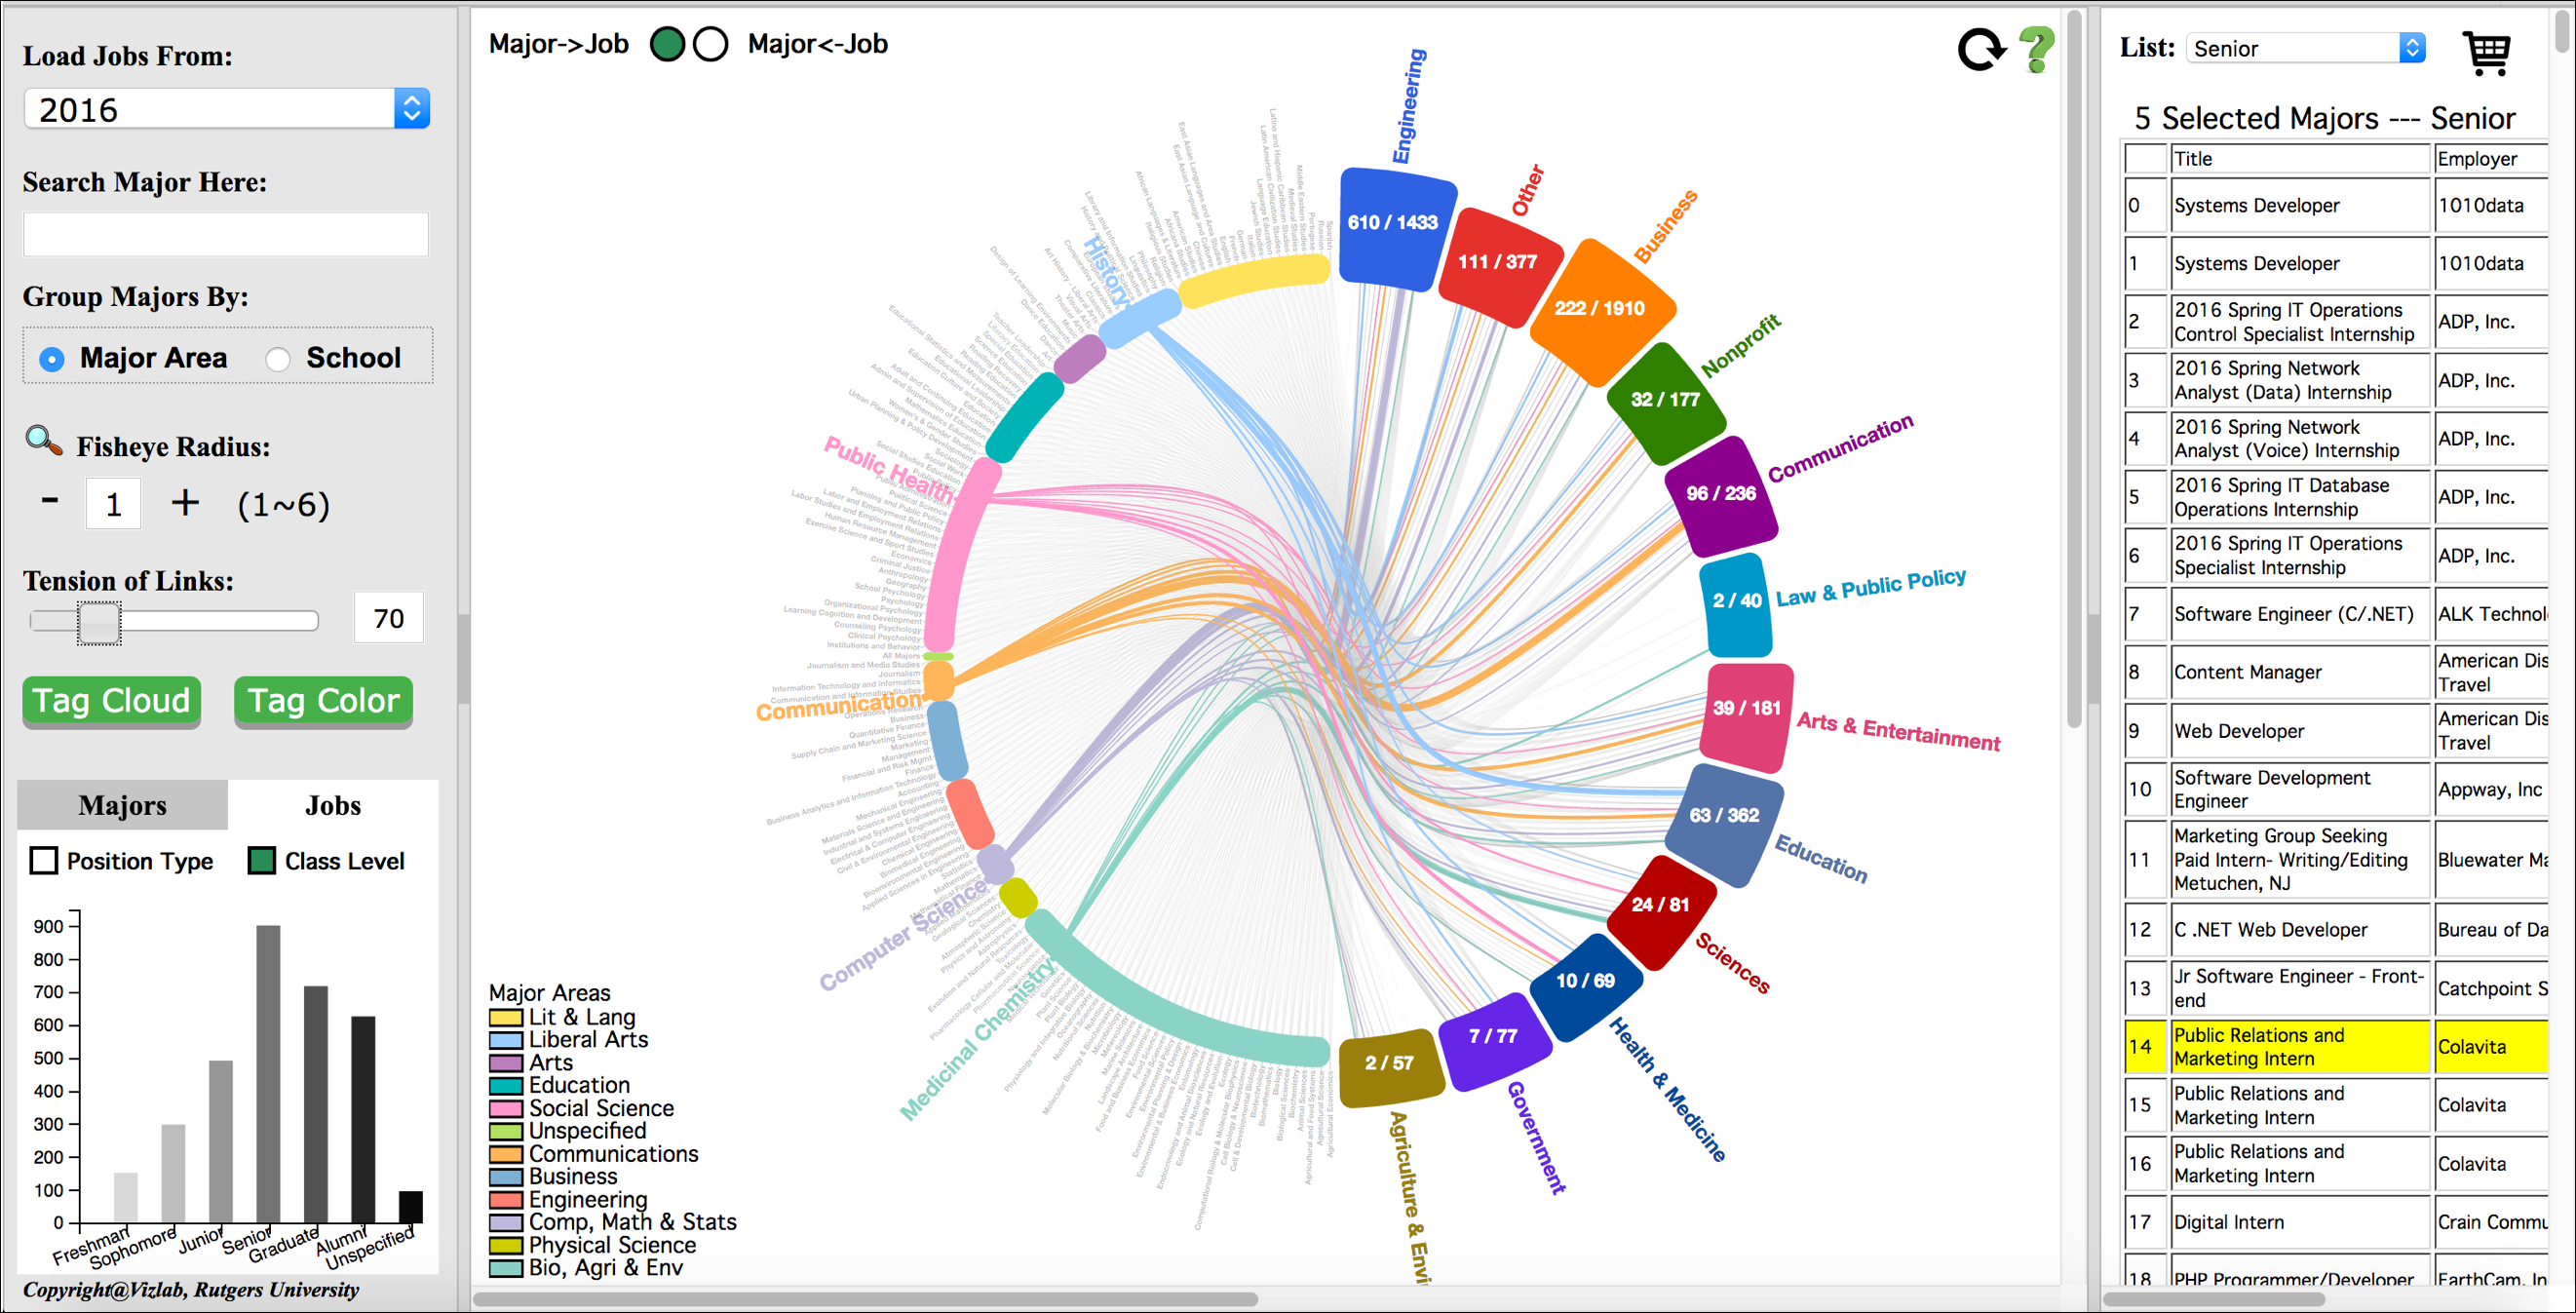
This is a visualization to explore the connections between majors and job postings. It provides an interactive view of the entire job posting database within a focus+context framework. An Intro video can be found here. |
|
|
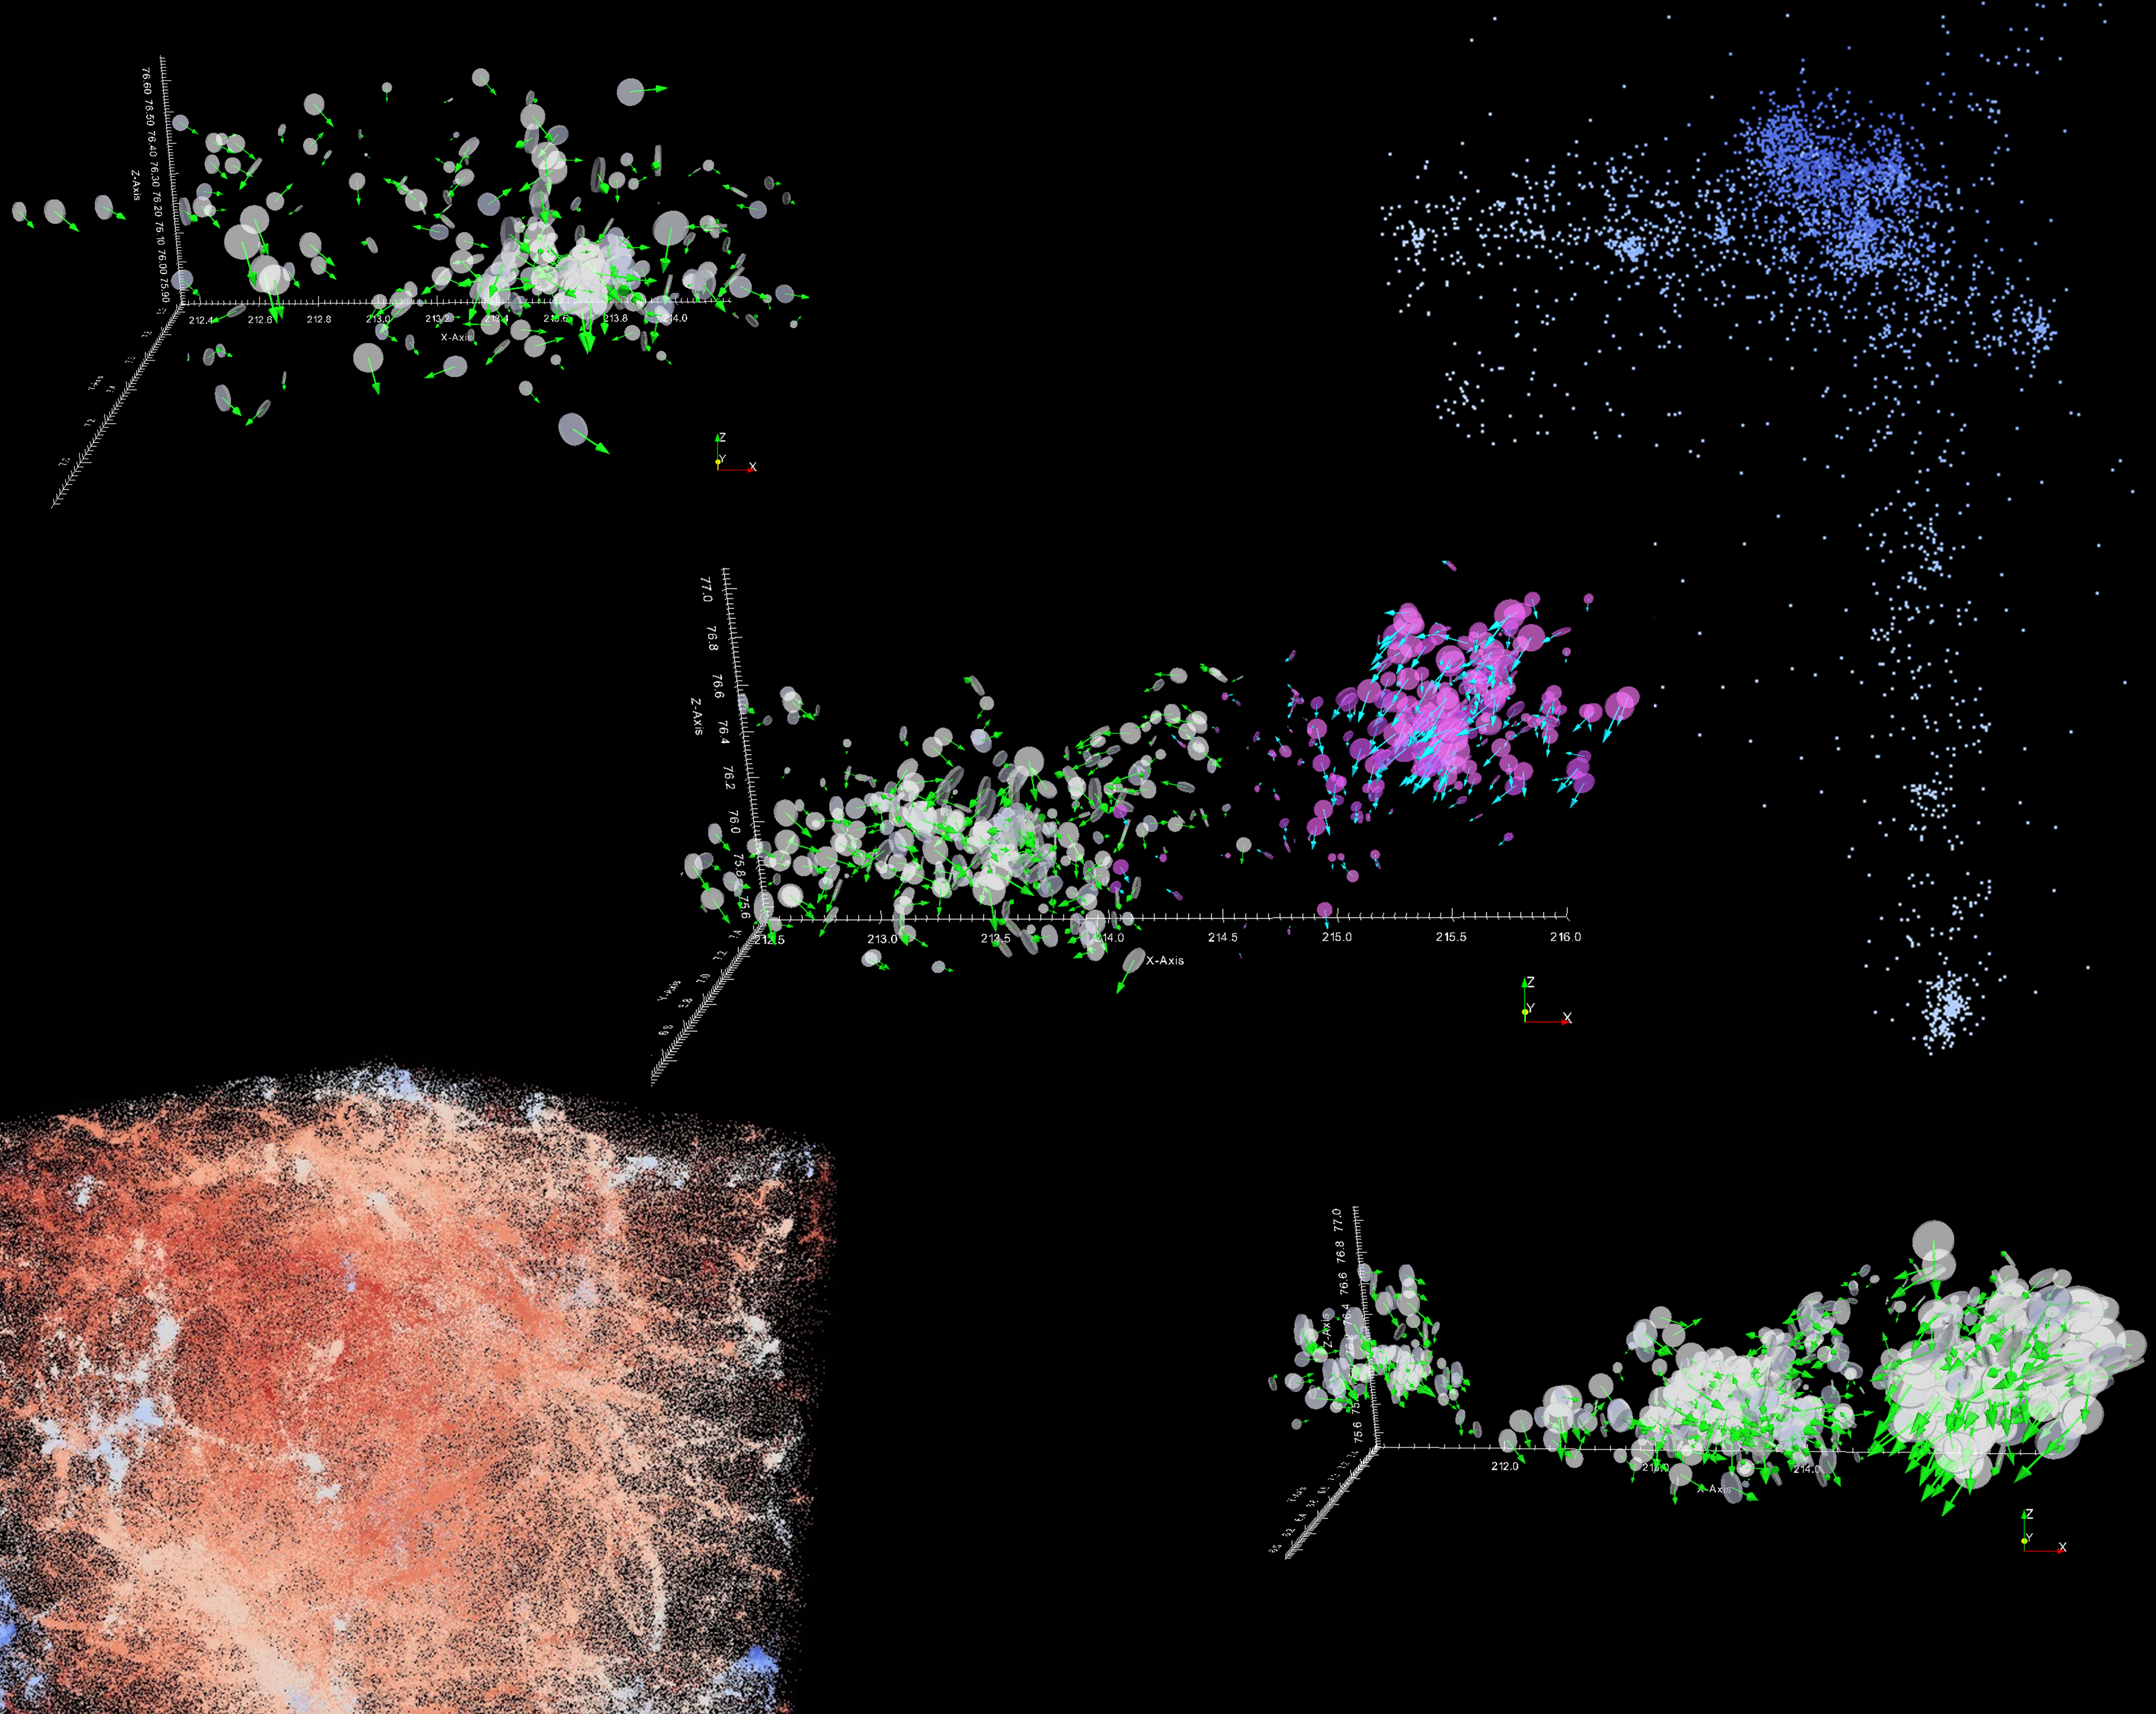
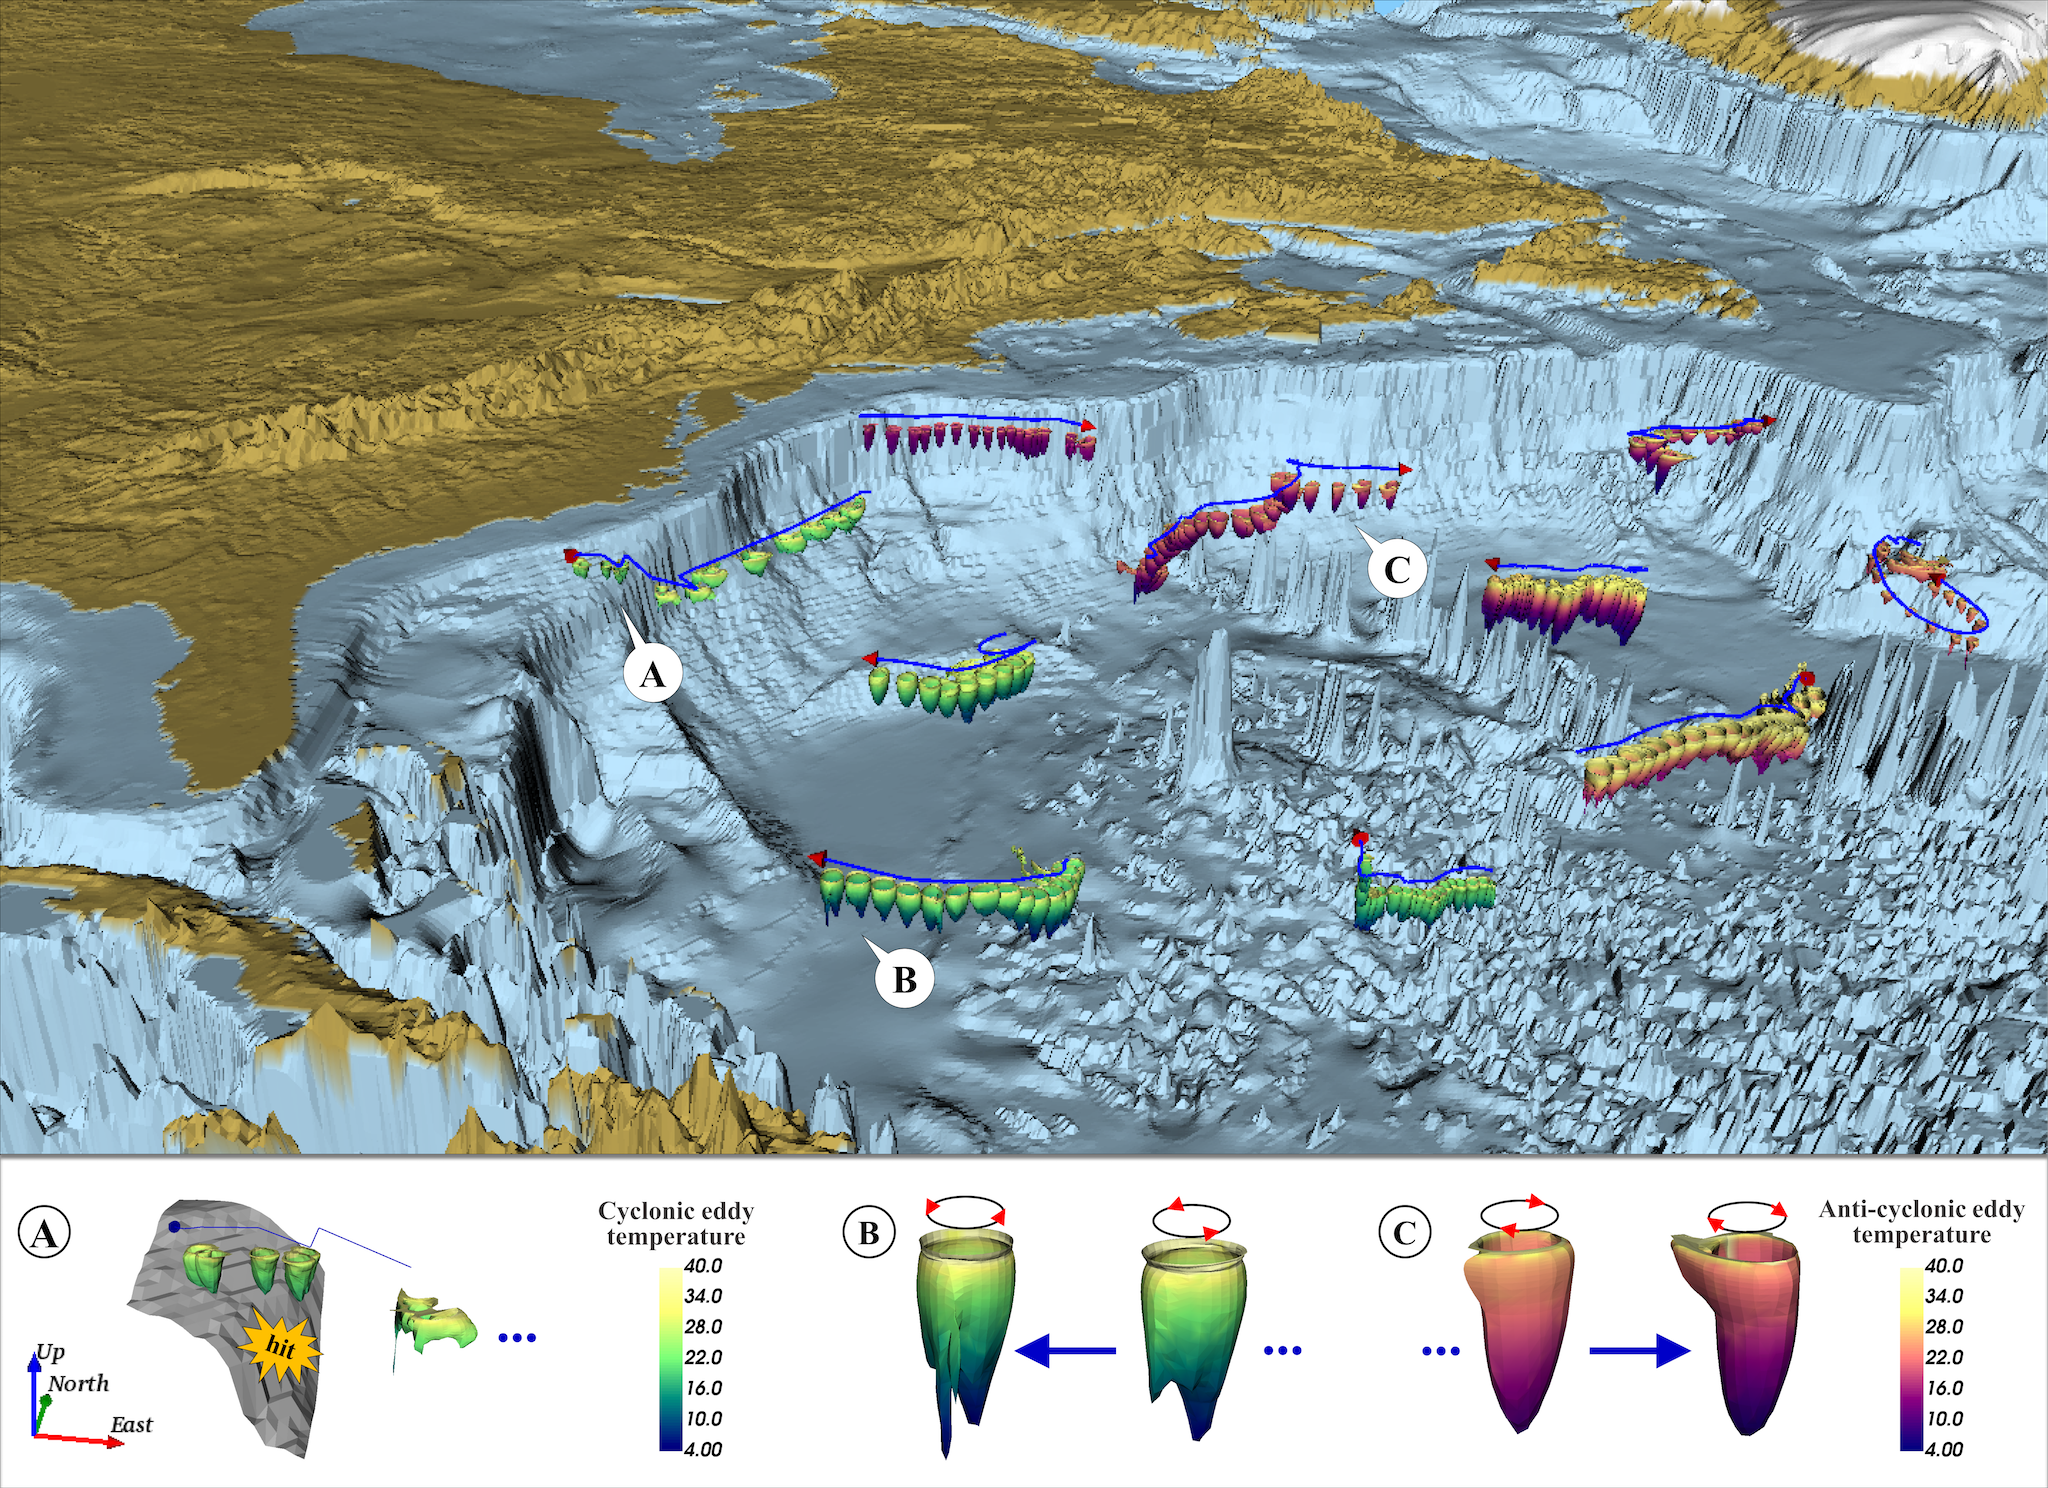
ILLUSTRATIVE OCEAN EDDY VISUALIZATION In this work, we apply a feature-based method to track instances of ocean eddies through the time steps of a high-resolution multidecadal regional ocean model and generate a series of eddy paths which reflect the life cycle of individual eddy instances. Illustrative visualization techniques, including visual effectiveness enhancement, focus emphasis (or focus+context), and smart visibility, are combined with the extracted volume features to explore eddy characteristics at different levels. |
|
|
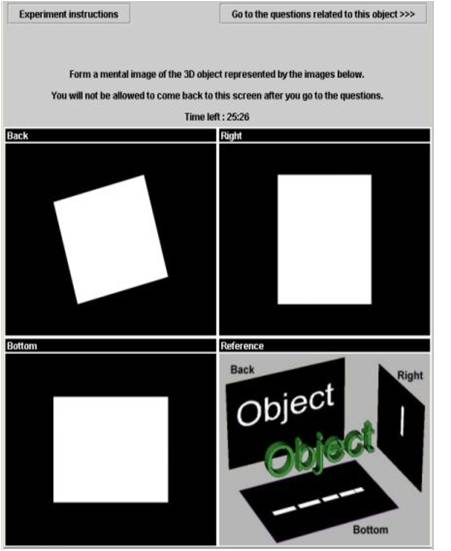
Our goal is to determine how humans understand visualizations and why are visualizations difficult for some. We use well-known individual differences in cognitive skills such as spatial abilities to understand the problems that affect people’s understanding of a visualization. |
|
|
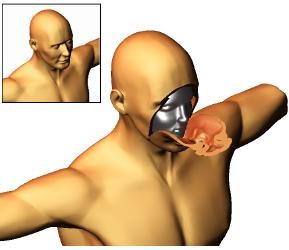
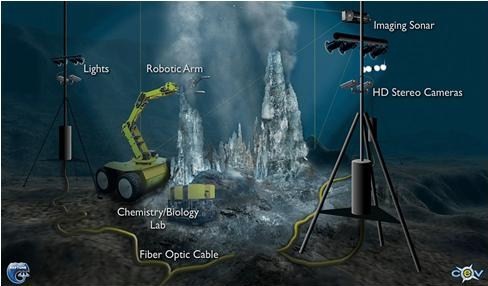
ACOUSTIC IMAGING & COMPUTER VISUALIZATION Our primary goal is to best illustrate the expansion of the plumes and what enhancements would make viewing this data most useful, especially to scientists who want to analyze the plume. |
To see the past projects, please click here