You are here
Particle Simulations of Plasma Turbulence
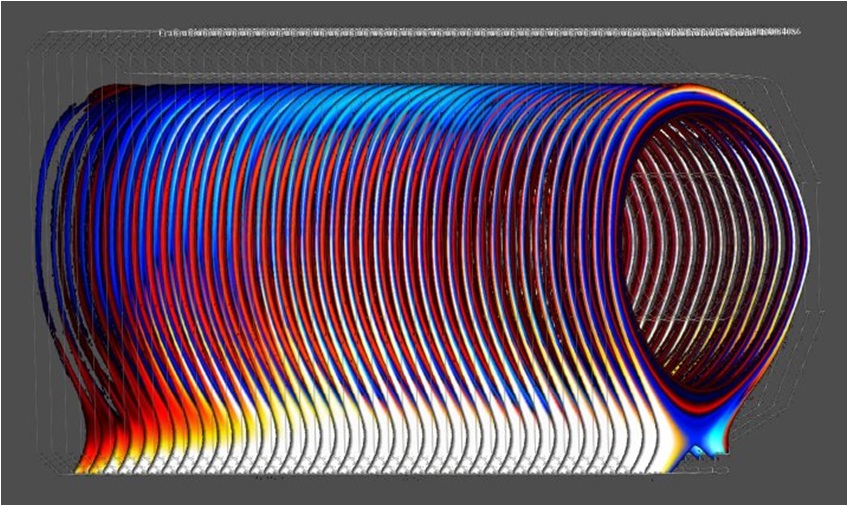
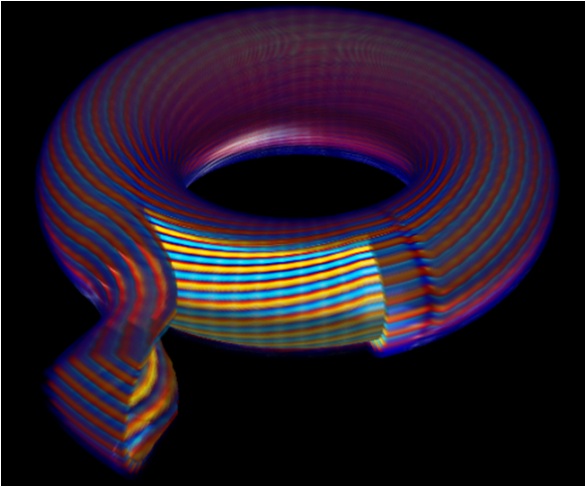
VIEW OF TORUS
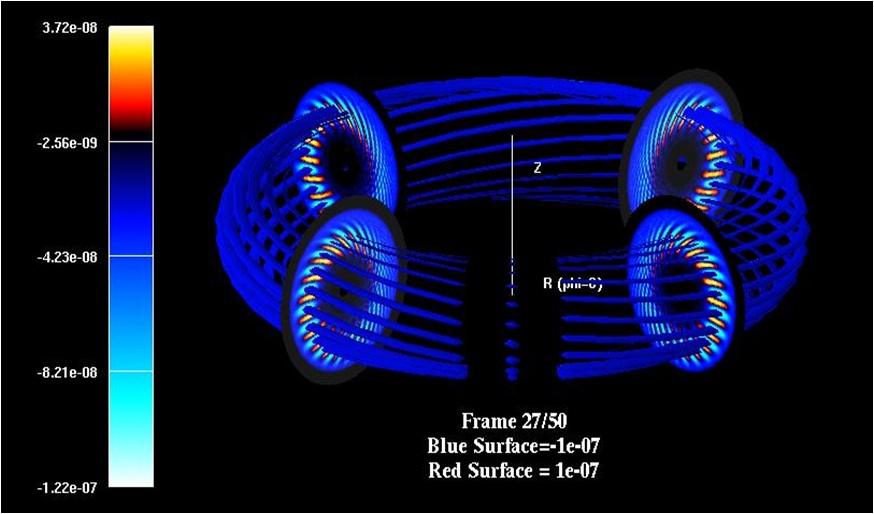
INITIAL CONDITION
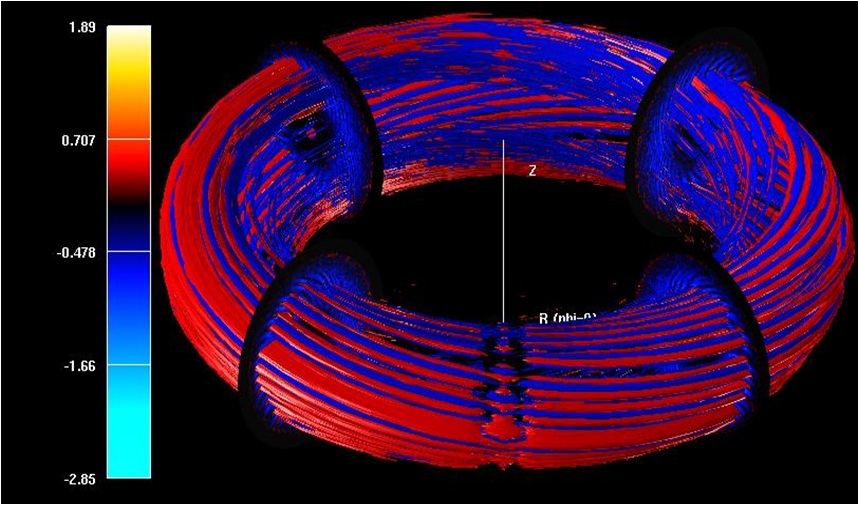
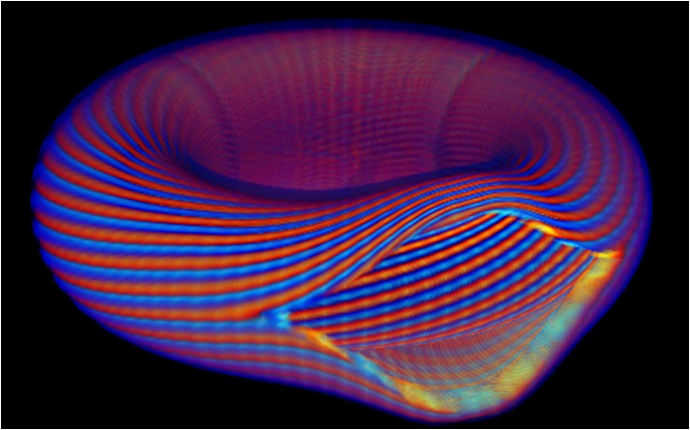
SIMULATION WITH ZONAL FLOWS
SIMULATION WITHOUT ZONAL FLOWS
COMPARISON OF NONLINEAR MODE STRUCTURE: EFFECTS OF ZONAL FLOWS
LINEAR EIGENMODE: SAME STRUCTURE WITH OR WITHOUT ZONAL FLOWS
NONLINEAR MODE STRUCTURE: DECORRELATION BY ZONAL FLOWS
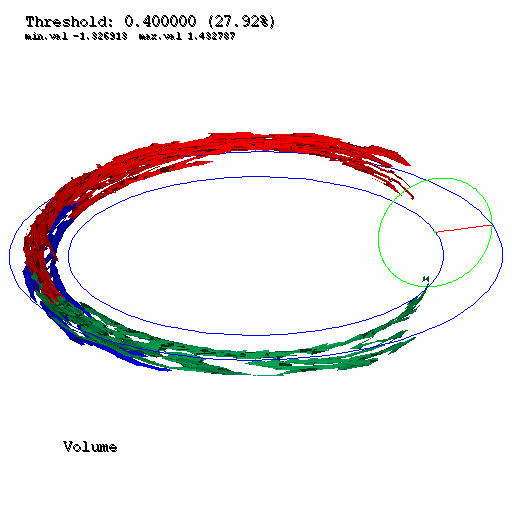
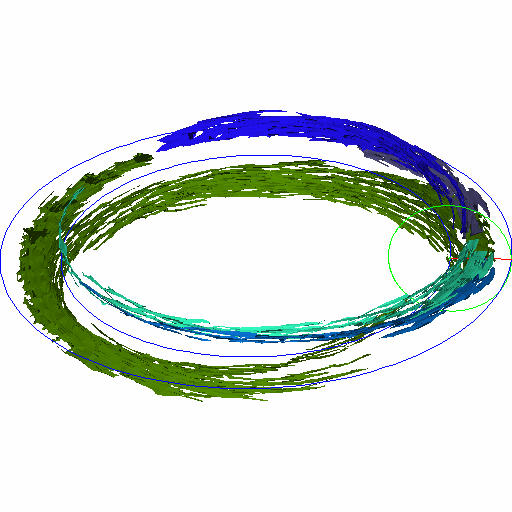
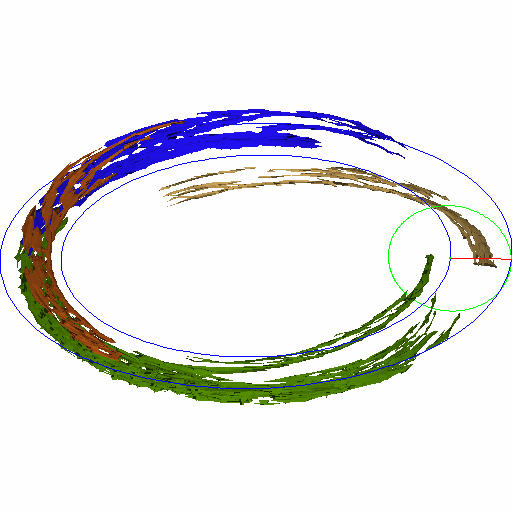
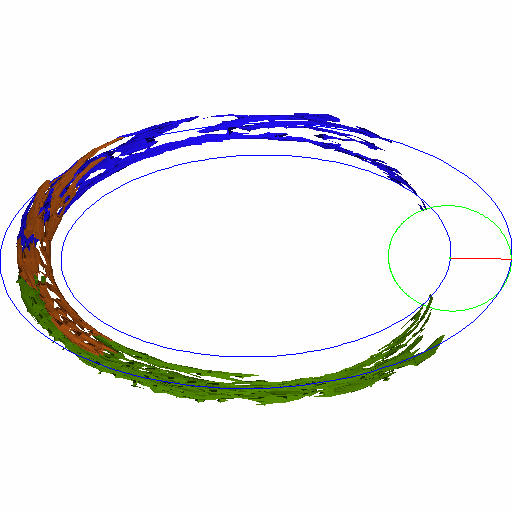
OBJECT SEGMENTATION RESULTS
Object Segmentation Result of BP0500 dataset. Threshold Value is 0.4. Minimum object size is 200.We use computed volume to color the objects.
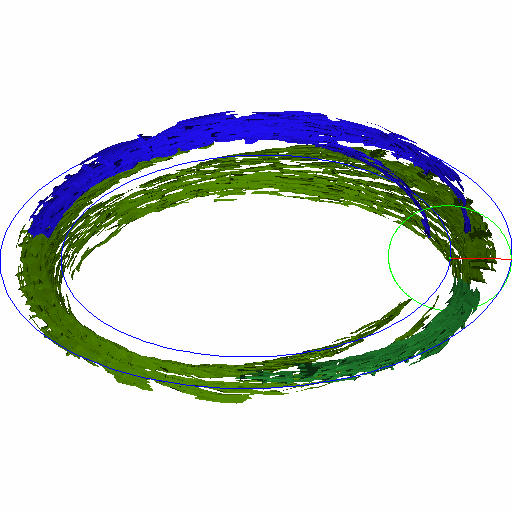
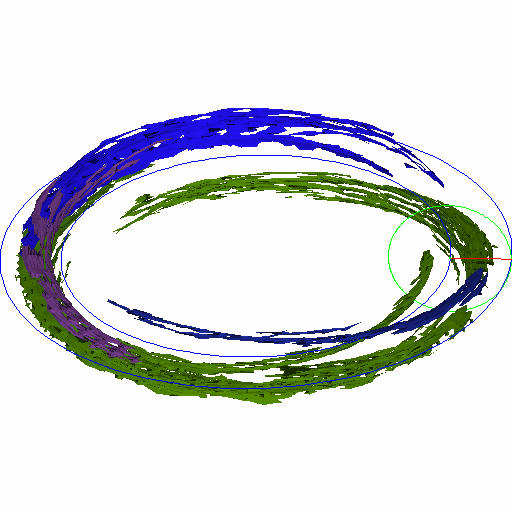
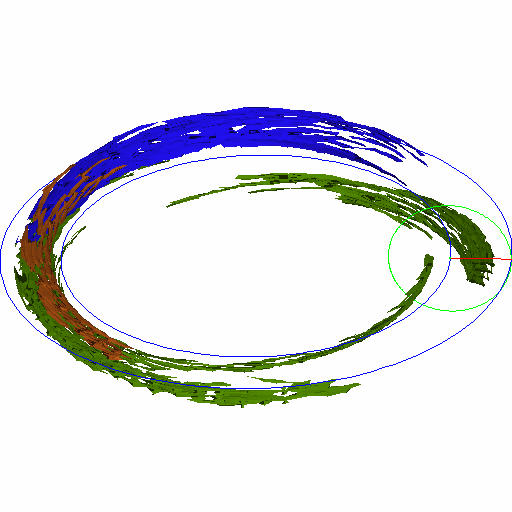
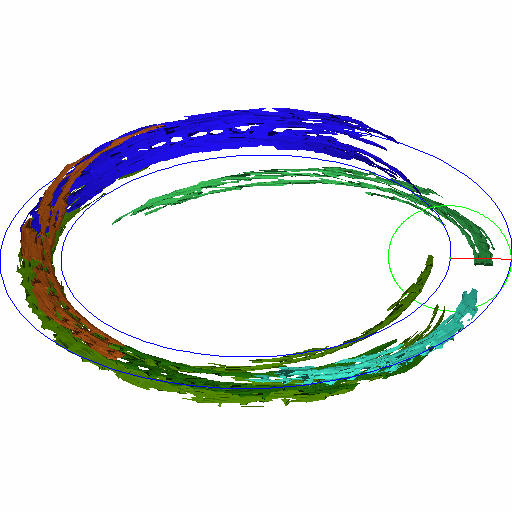
FEATURE TRACKING RESULTS
T0500 T0519 T0529
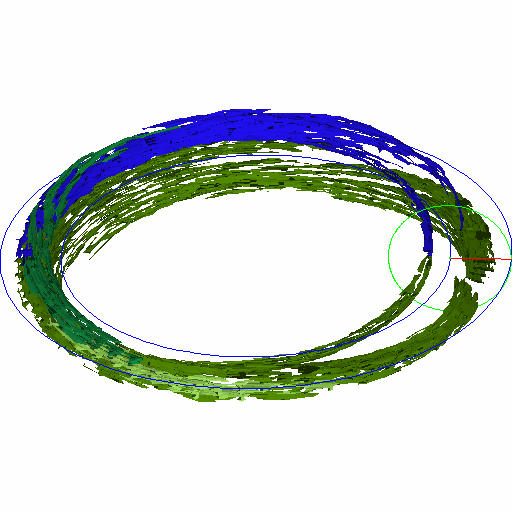
T0539 T0549 T0559
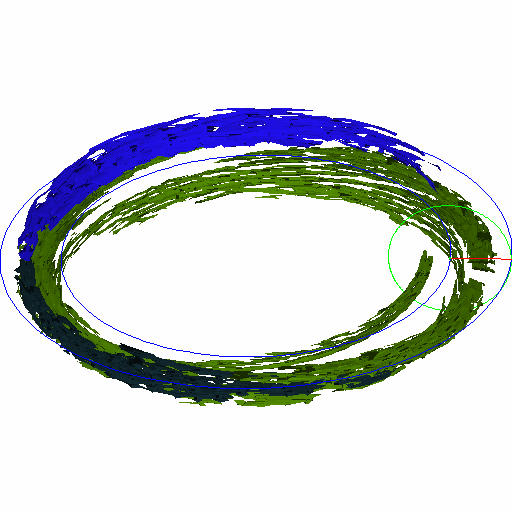
T0569 T0579 T0599
CPES Visualization
We would like to thank Dr. Zhihong Lin at Princeton Plasma Physics Laboratory (PPPL), for the simulation model and dataset.